Real-time financial dashboards
Live metrics, scenarios & goals — all on one dashboard.
Parallel puts all your core metrics into a single live dashboard overlaid with editable scenarios and assumptions. Change a driver, watch your runway respond.

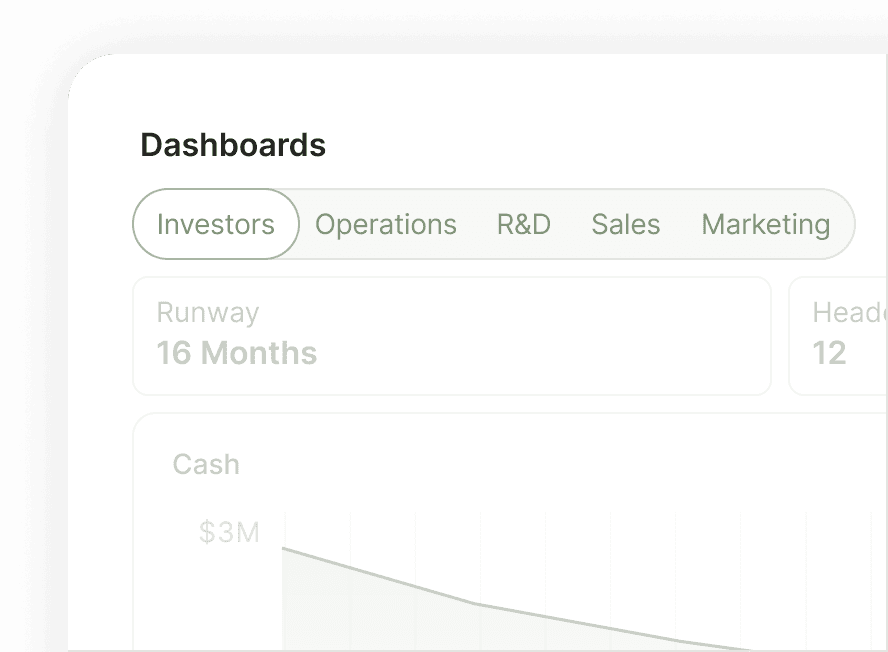
See the metrics that matter for the decisions you’re making
Financial models are designed to answer all types of questions across the business, but they can be hard to digest when the data is buried inside complex spreadsheets.
Parallel lets you create purpose-built dashboards that surface the right metrics for each objective, audience, and conversation. From business health checks and board meetings to revenue planning and operational analysis, every dashboard is powered by the same financial model while highlighting the data that matters most.
Focus on the metrics that drive decisions, without losing the depth and accuracy behind them.

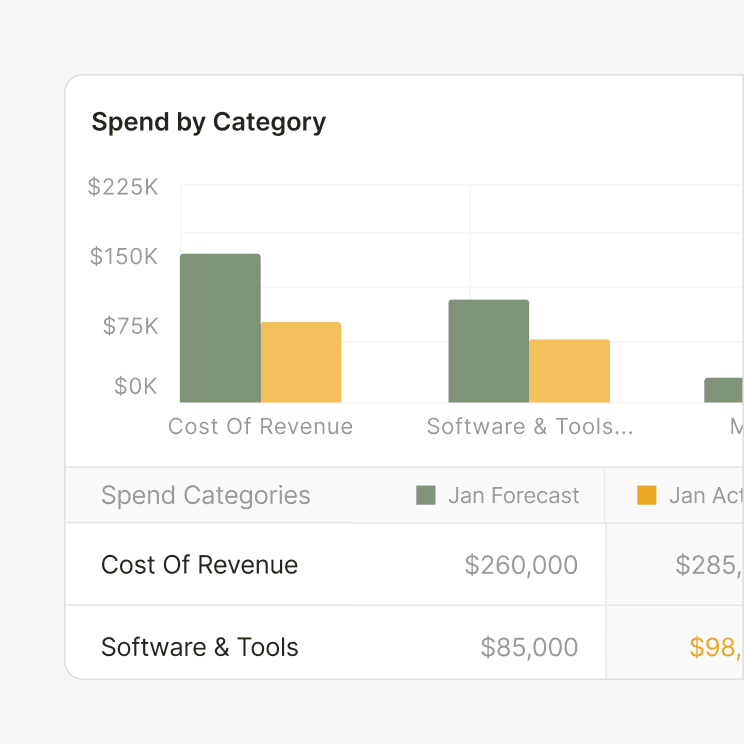
Customize every tile
Pin runway, cash balance, expenses, revenue, cash flow, and the SaaS metrics that matter most in your stage of growth.
Share audience-specific dashboards
Different audiences, different dashboards. Customize an operating, board, and VC views so each set of stakeholders sees what’s most important to them.
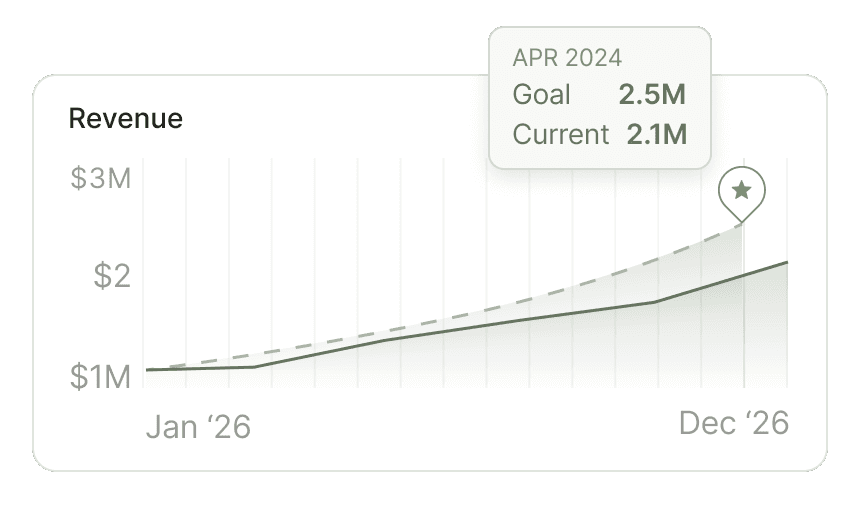
Overlay goals across metrics
Add your goals to the metrics they map to. When you run a scenario you see how each metric tracks against your targets.

Measure against industry benchmarks
See your actuals alongside stage-specific SaaS benchmarks so you know where you're outperforming and where you’re trailing.
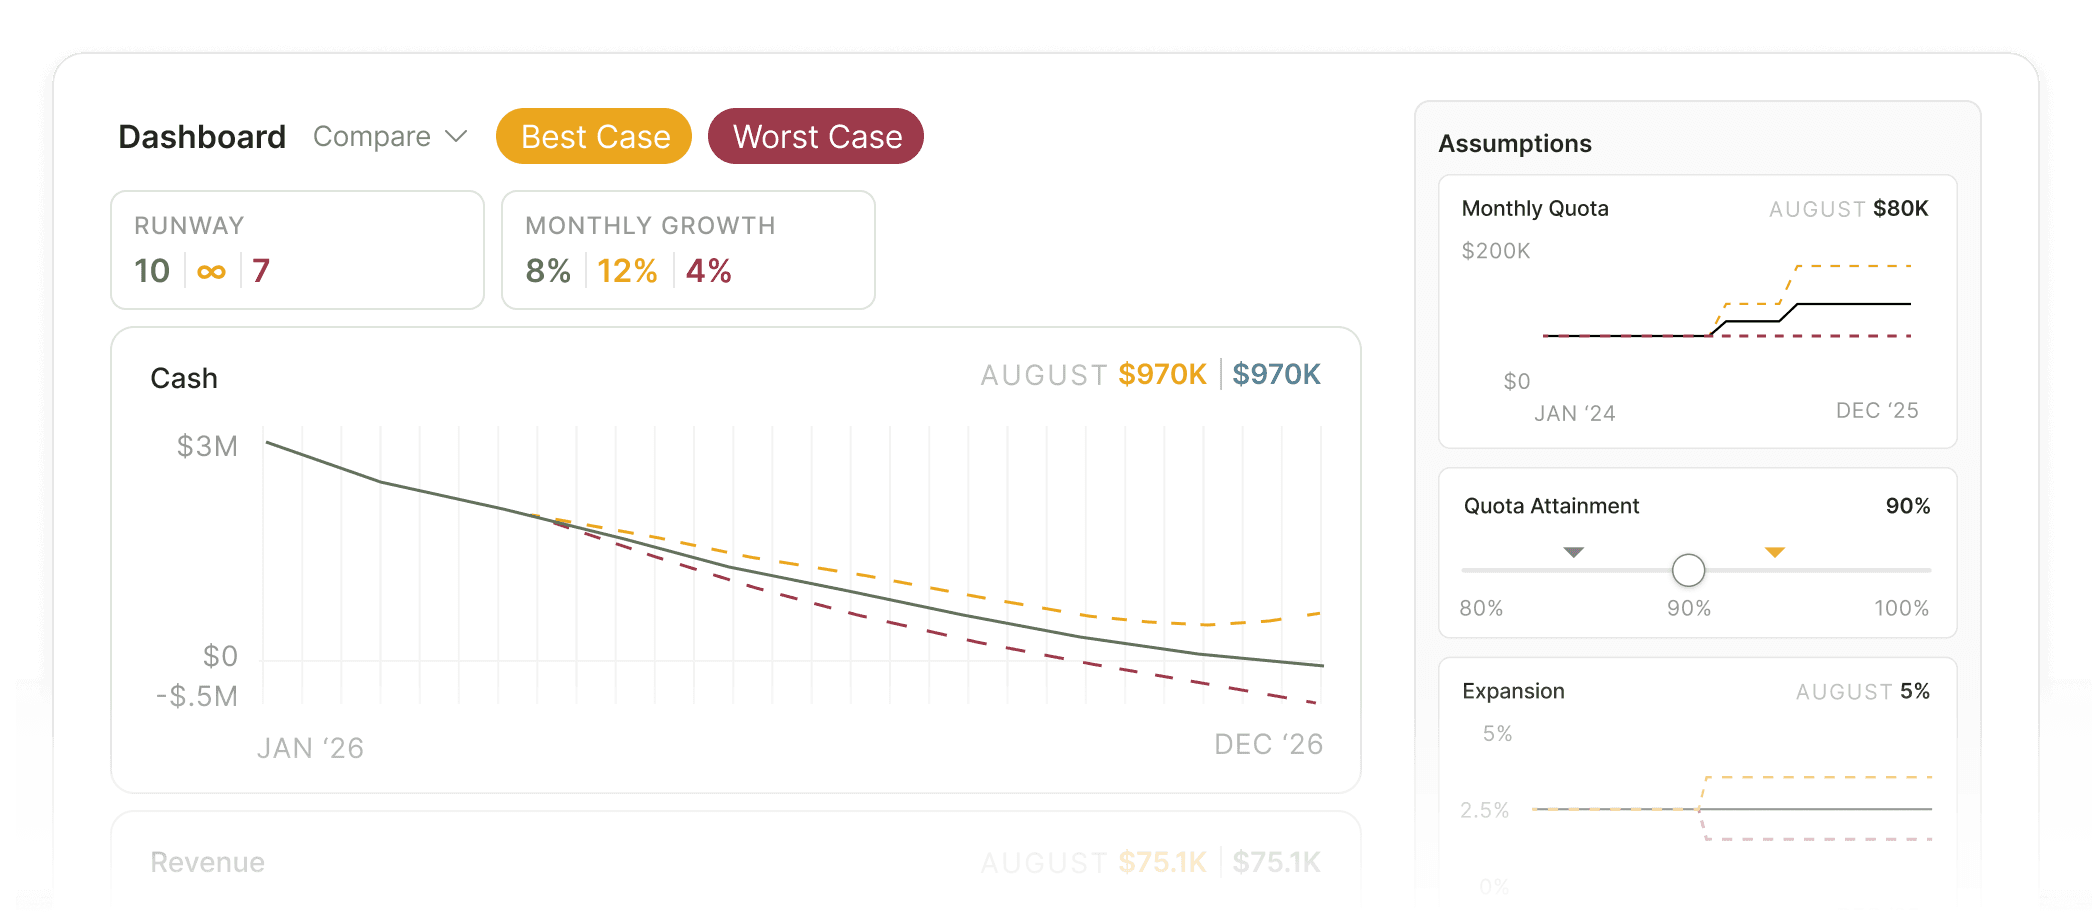
Surface key assumptions
Adjust inputs like churn rate, quota, ramp, and conversion to see how metrics respond without editing your core model.
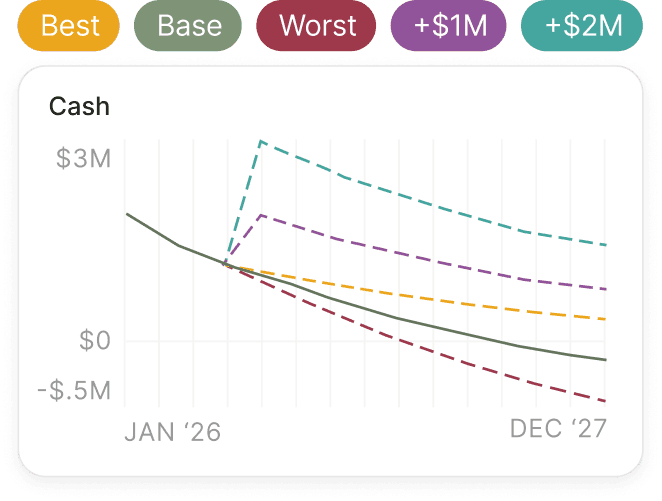
Compare scenarios & plans
Overlay scenarios on the dashboard to see variations in runway, burn, and revenue. Compare the current model to past plans to see what's changed since your last review.
Get control of your financial situation

Runway Clarity
Know your runway the moment your data changes, with full visibility into what moved the needle.


Reporting
No discrepancies. Your operational dashboard and reports are built on the same data, so they tell the same story.

Live integrations
Your accounting integration keeps historical actuals current on the dashboard, so the metrics never drift from your real books.
Frequently Asked Questions
Which metrics does Parallel track?
Can I customize my dashboard?
How often does the dashboard update?
What's the difference between Dashboards and Metrics vs Reporting?
Can I share my dashboard with my investors or team?
Get the clarity you need to move forward with confidence
Get every metric, scenario, and assumption you want to test in a single, live view.
Start your free trial
15-day free trial. No credit card required.